
By Heath Gilbert | Cameron School District Exposed
A Question Worth Answering
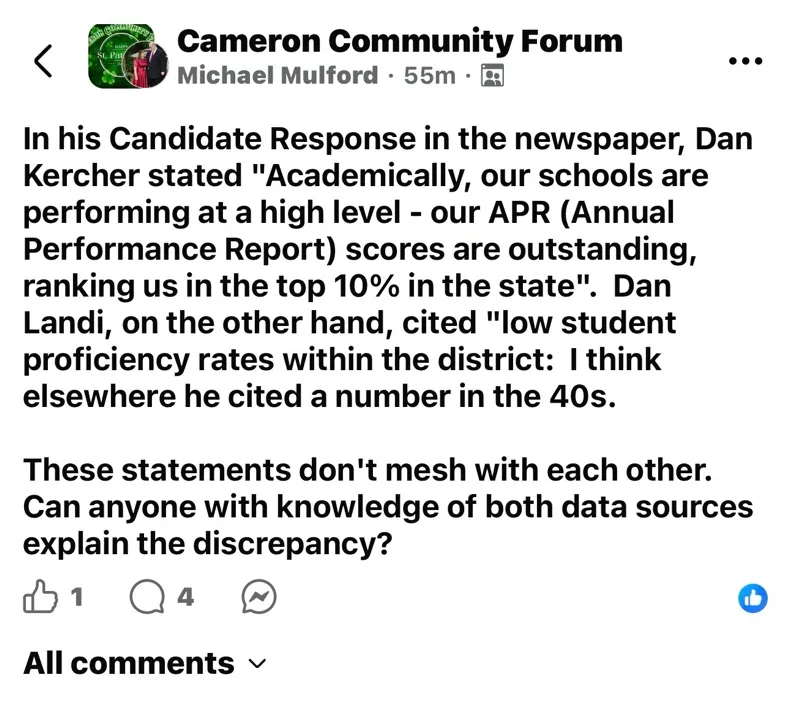
Earlier today, a post appeared in the Cameron Community Forum that caught my attention. Community member Michael Mulford had noticed something that didn’t add up. School board candidate Dan Kercher, citing the district’s Annual Performance Report, says Cameron R-1 ranks in the top 10 percent of Missouri schools academically. Challenger Dan Landi, citing MAP test scores, says fewer than half of Cameron students are reading at grade level. Both claims are being made about the same district, at the same time. Mulford’s question was direct: these two candidates’ statements don’t mesh with each other. Can anyone explain the discrepancy?
I noted in the comments that the APR and MAP test scores are two entirely different things — that attendance and graduation rates factor into the APR. Mulford replied that this was in the right direction of what he was trying to understand. That exchange struck me as an opportunity to write something the broader community could use heading into the April board election.
Both candidates are telling the truth. The confusion comes from the fact that they are measuring entirely different things. And understanding why each candidate may have chosen the metric he did tells you something important about where each one stands.
What Is the MAP?
MAP stands for Missouri Assessment Program — the metric Dan Landi has cited when pointing to low student proficiency in Cameron R-1. It is designed to measure how well students acquire the skills and knowledge described in the Missouri Learning Standards, yielding information on academic achievement at the student, class, school, district, and state levels. In plain terms: it is an academic content test. It measures what kids actually know. (DESE Missouri Assessment Program)
All students in grades 3–8 take MAP assessments each year in English Language Arts and mathematics. Science is assessed in grades 5 and 8. High school students take End-of-Course assessments in Algebra I, English II, Biology, and Government.
Scores are reported in four performance levels: Advanced, Proficient, Basic, and Below Basic. A student in the Proficient or Advanced level has met the standard. Students in the Below Basic and Basic levels have typically mastered some foundational skills, but additional learning is needed to achieve the deeper levels of understanding outlined within the Missouri Learning Standards.
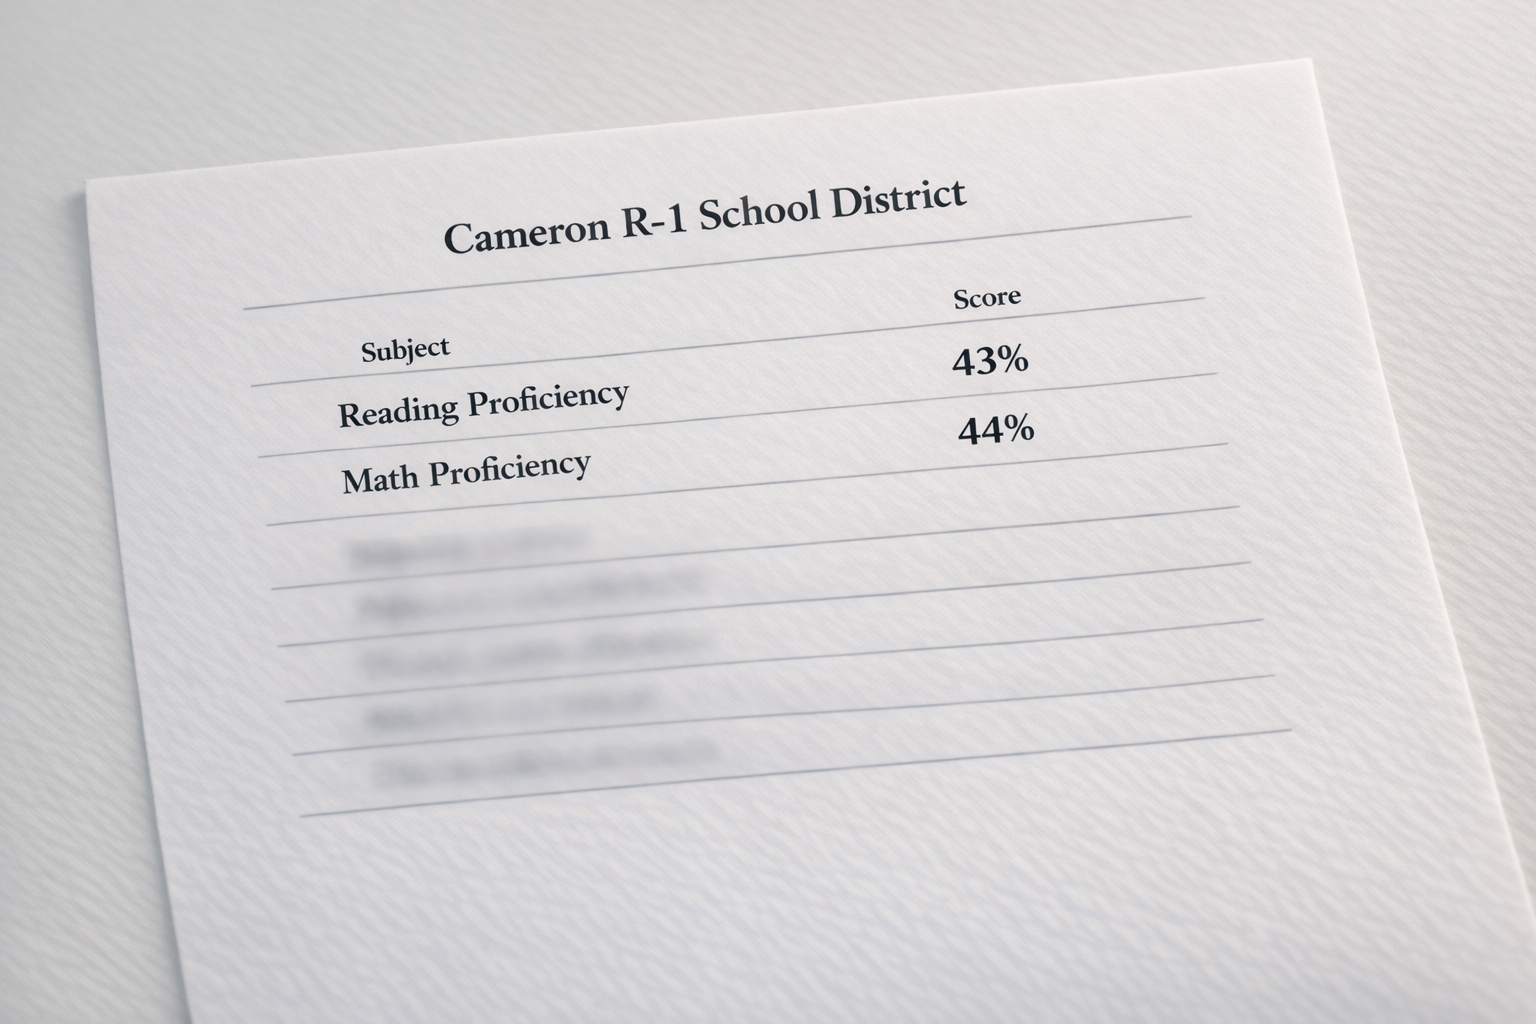
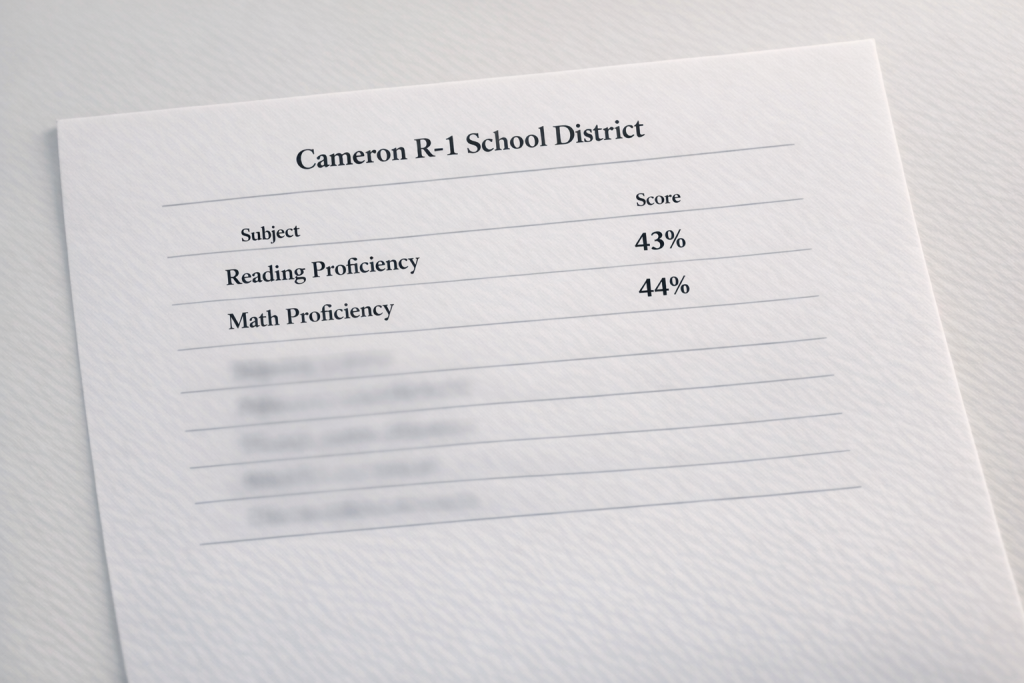
When Dan Landi references roughly 43 percent of Cameron students performing at grade level, he is citing the share of students scoring Proficient or Advanced on the MAP. That is a raw academic achievement number — nothing added, nothing softened.
One more thing worth understanding about the relationship between these two measurements: you can have MAP scores without an APR, but you cannot have an APR without MAP scores. The MAP is a standalone assessment that stands on its own. The APR is a composite report that depends on MAP data as one of its core inputs. When the two appear to contradict each other, it is because the APR has taken the MAP data and combined it with a range of other factors — not because they are measuring the same thing differently.
The MAP’s Limitations
The MAP is not a perfect instrument, and it is fair to say so. Students receiving special education services are required to take the MAP — including assessments covering content they may never have been taught. A student with a significant learning disability sitting for a grade-level math test is not a clean measure of whether the district is teaching effectively. That result still counts in the district’s totals.
It is worth noting that this requirement is not new. Prior to the No Child Left Behind Act signed into federal law in 2002, special education students were frequently excluded from standardized state testing altogether. NCLB mandated their inclusion, and that requirement has remained in place ever since, carried forward through the Every Student Succeeds Act in 2015. The SPED participation requirement has been consistent for more than two decades — it cannot explain a recent decline in MAP scores because it was present during the years when scores were higher as well.
There is also the motivation problem. The MAP carries no consequence for individual students — no grade, no graduation requirement, nothing. Some students treat it accordingly.
These limitations are real and worth acknowledging. But here is the critical point: they have always been real. The special education population, the low-motivation test-takers — none of this is new to Cameron R-1. MAP results provide snapshots of point-in-time achievement, and those snapshots have been taken consistently, year after year, under the same conditions. If the district’s proficiency rate has declined over time, the flaws in the instrument cannot explain that decline. They were present before. Something else changed.
What Is the APR?
APR stands for Annual Performance Report — the metric Dan Kercher has cited when describing Cameron R-1 as a top-performing district. APRs are produced by the Missouri Department of Elementary and Secondary Education (DESE) and demonstrate the progress educators, students, parents, and the community are making toward meeting the standards and indicators in Missouri’s School Improvement Program — currently in its sixth iteration, known as MSIP 6. The APR is the primary tool DESE uses to classify and accredit school districts statewide. (DESE Annual Performance Report)
The APR is not a test score. It is a composite rating built from multiple categories. Under MSIP 6, it is scored out of 200 total points. Performance — which includes academic achievement, growth, graduation rates, and college and career readiness — accounts for 140 of those points, or 70 percent of the total. Continuous Improvement — which covers planning documents, school climate surveys, and other process measures — accounts for the remaining 60 points, or 30 percent.
Within the performance measure, MAP test scores are one component — but the performance measure also includes graduation rate, graduate follow-up, and success-ready indicators. The continuous improvement section is largely based on the quality of a district’s planning documents and other process-oriented inputs.
In other words: MAP test scores are one ingredient in the APR, not the whole recipe.
The APR’s Limitations
Here is where the math becomes important — and I want to show my work so you can verify it yourself.
The APR is scored out of 200 total points. According to the MSIP 6 Comprehensive Guide published by DESE, the breakdown is as follows: academic achievement status — meaning the percentage of students who are actually proficient on the MAP — is worth a maximum of 48 points. Academic growth is worth a maximum of 36 points. Together, those two measures account for 84 out of 200 possible points. Eighty-four divided by two hundred is 42 percent. Less than half. You can verify the full point breakdown in the MSIP 6 Comprehensive Guide published by DESE.
The remaining 58 percent of points come from other categories. Graduation rates are worth up to 20 points. The district’s improvement planning document is worth up to 30 points. A school climate and culture survey submission is worth 4 points. According to an analysis by the Show Me Institute, virtually every district in Missouri earns full marks on those non-academic categories automatically — which means a district can enter the APR calculation with the majority of its points already secured before a single test score is considered.
This is precisely the argument a reform-minded candidate like Dan Landi would make for ignoring the APR altogether and going straight to raw MAP scores. If more than half of a district’s rating is built on factors that nearly every district maxes out automatically, what is the APR actually distinguishing? Strip away the planning documents, the graduation rates, and the surveys, and what remains is the question Landi is asking: how many kids can read?
The APR also does not answer a question that the MAP data makes unavoidable: if fewer than half of Cameron students are reading at grade level, how is the district graduating 97 percent of them? What does that diploma represent? The APR rewards the graduation rate as a positive outcome — and a high graduation rate is genuinely good news in many respects — but it does not ask whether the students crossing that stage can read and do math at the level Missouri says they should. That gap between the two numbers is something the APR, by design, does not explain.
A Note Before the Numbers
I am not a trained data analyst, and I have no formal background in reading APR reports. My interpretation of this data is based on my reading of the publicly available charts and on APR presentations I have observed being made to the Cameron R-1 Board of Education at meetings I have attended. If I have misread something, that is not intentional, and I welcome correction.
I want to take a moment to acknowledge Dr. Angie Ormsby, the district’s assistant superintendent, who is responsible for tracking the APR and presenting updates to the board. In my observation, Dr. Ormsby has done a commendable job at board meetings of helping both the board and the community understand what the APR measures and what it means. Her presentations have contributed to my own understanding of this data.
If you want to verify the data in this article, ask questions, or get an authoritative explanation directly from the district, Dr. Ormsby can be reached at aormsby@cameronschools.org.
Cameron’s APR: What the Categories Actually Reveal
The district’s 2025 APR Data Tracking charts — published by Cameron R-1 on its own website — break down performance by category. Those categories tell an interesting story about why Cameron ranks where it does. (Cameron R-1 APR page)
In the areas measured by attendance, graduation, and college and career readiness, Cameron is performing at the highest designation level. The graduation rate came in at 96.70 percent, earning a “Target” designation — the top tier — and 20 out of 20 possible points. Attendance district-wide hit 91.50 percent, also rated Target. Graduate follow-up came in at 95.90 percent — again, Target. Advanced credit participation, which includes dual enrollment and AP coursework, earned a perfect 10 out of 10 points. Kindergarten Entry Assessment completion hit 99.10 percent.
These are genuinely strong numbers. A district where nearly 97 percent of students graduate and 91 percent show up consistently is doing something right operationally.
In academic achievement growth — meaning how much students improved — the district earned 100 percent of available points in ELA and math for all students, rated Target. A student can enter a grade level behind and still show strong growth without crossing the proficiency threshold. The APR rewards that growth, and Cameron is earning full marks for it. Whether that growth is sufficient to eventually close the proficiency gap is a separate question the APR does not directly answer.
In academic achievement status — meaning raw proficiency on MAP assessments — the district earned 75 percent of available points across ELA, math, science, and social studies, rated “On-Track.”
What the MAP Numbers Actually Show
The MAP data, drawn from the district’s own published comparison charts covering 2021-22 through 2024-25, shows where proficiency actually stands.
In ELA, most grades have landed in the high 30s to mid-40s range over the past four years. The 2024-25 year showed genuine improvement in several grades — 4th grade ELA jumped to 64 percent proficient, and 3rd grade reached 47 percent. That is a positive trend worth acknowledging.
In math, the picture is more uneven. Third grade math reached 49 percent and 4th grade reached 56 percent in 2024-25 — encouraging signs at the lower grades. But 8th grade math proficiency came in at just 25 percent, meaning three out of four 8th graders are not meeting the state’s math standard for their grade level. Across four years of data, no single grade level has consistently cleared 50 percent proficiency in both ELA and math.
The district’s charts also show that Cameron frequently scores above the Missouri state average in individual grade levels and subjects. That is the factual basis for the “top 10%” claim, and it is accurate as far as it goes. But context matters: Missouri’s statewide proficiency averages are themselves below 50 percent in most grades and subjects. Outperforming a low statewide average does not automatically mean students are performing at grade level — it means they are performing better than other Missouri students who are also, in many cases, not yet there either.
That is not a knock on Cameron specifically. It is a reflection of where Missouri public education stands post-pandemic, and it is exactly why this conversation about APR versus MAP matters.
What Each Candidate Might Say in Defense of Their Number
The following is my own analysis. Neither candidate has told me directly why they chose the metric they did. I am making reasonable assumptions based on their stated positions and public record.
The Case for the APR — as Kercher Might Frame It
A supporter of the APR would argue that it provides a more complete and fair picture of a school district than a single test score. A district that graduates nearly 97 percent of its students, maintains strong attendance, offers dual enrollment and AP coursework, and demonstrates measurable year-over-year student growth is clearly doing something right. Growth matters — a student who enters a grade level behind and makes significant gains may still fall short of the proficiency threshold while representing a genuine success story for that school.
The APR also accounts for the reality that MAP scores reflect only one day of testing under conditions that are not always ideal. A student who knows the test carries no personal consequence may not put forth their best effort. The APR smooths out those variables by measuring outcomes across an entire school year.
Notably, Kercher himself did not hide behind the APR when pressed directly. In his written response to candidate questionnaire questions published at Breach Holder, he stated plainly:
“No, a 43% proficiency rate is not acceptable. When less than half of a student body is reading at grade level attention to that issue must be a priority.”
He went further, setting a specific goal of 70 percent reading proficiency within five years. That acknowledgment is significant, and voters should weigh it alongside his APR framing.
The Case for the MAP — as Landi Might Frame It
A supporter of the MAP would argue that it cuts through the noise and asks the only question that truly matters: can these kids read and do math at grade level? Every other metric — graduation rates, attendance, college readiness scores — is downstream of that basic question. And right now, for more than half of Cameron students, the answer is no.
The graduation rate argument actually raises a pointed question from this perspective: if 97 percent of students are graduating, but fewer than half can read at grade level, what does that diploma represent? Are students being moved through the system without meeting the academic standards the diploma is supposed to certify? Landi addressed academic performance directly in his own questionnaire response:
“The current rate of academic achievement in our schools is unacceptable. Teaching students the necessary skills to succeed in life is the reason schools exist. Academic achievement should be paramount in every school district.”
A MAP-focused critic would also note that growth scores, however impressive, are only meaningful if they eventually translate into proficiency. Earning full marks for growth while still sitting below 50 percent proficiency year after year suggests the growth, however real, is not fast enough to close the gap in any meaningful timeframe.
Why Each Candidate May Have Chosen His Number
Again — this is my analysis, not something either candidate told me directly. But common sense makes these observations reasonable.
Dan Kercher supports the current direction of Cameron R-1. The APR, with its composite structure and emphasis on growth, graduation, and attendance, tells a story of a district making progress — one that compares favorably to peers statewide. For a candidate running in defense of the status quo, the APR is the natural metric to reach for. And as noted above, when asked directly about MAP scores, Kercher did not dispute them — he acknowledged the problem and offered a five-year goal.
Dan Landi believes the district needs significant improvement. The MAP test scores are raw, unadorned, and focused on a single question: are Cameron students learning what Missouri says they should know? For a candidate running on accountability and change, MAP data makes the case plainly.
Neither candidate is being dishonest. Both are selecting the evidence that supports their argument. The responsibility falls on voters to understand what each number actually measures before deciding which one matters more to them.
What to Take Away
Michael Mulford asked a fair question this morning: how can a district rank in the top 10 percent of Missouri schools while fewer than half its students read at grade level? The answer is that those two numbers come from two entirely different measuring systems. The APR measures a broad range of institutional factors — graduation rates, attendance, growth, planning, and college readiness — and Cameron earns high marks across most of them. The MAP measures one thing only: whether students are meeting Missouri’s academic standards in reading and math. A district can genuinely excel at the first set of measures while still falling short on the second. Both are true. They are not contradictions — they are different questions with different answers.
Thank you, Michael, for asking. Voters who take the time to look past the headline numbers and ask how they were calculated are exactly what a healthy community needs heading into an election. That question deserved a real answer, and I hope this provides one.
The APR tells you how Cameron R-1 performs across a broad set of institutional metrics. By those measures, Cameron is doing well. The MAP tells you whether Cameron students are meeting Missouri’s academic standards in reading and math. By that measure, most students are not yet there, though the most recent data shows encouraging movement in the lower grades.
Both numbers are true. Neither tells the full story alone. Cameron voters heading to the polls in April deserve access to both — and to understand what each one actually measures before they decide.

Source note: APR category data is drawn from the Cameron R-1 APR Data Tracking 2025 charts published by the district. MAP proficiency data is drawn from the district’s APR Data & MAP Comparison 2022-2025 charts from the same page. All underlying data originates with DESE. DESE’s APR and MAP resources: dese.mo.gov/quality-schools/accountability-data. Candidate questionnaire responses: breachholder.substack.com. APR point breakdown analysis: Show Me Institute. SPED testing history: No Child Left Behind & Special Education.
Heath Gilbert is an independent investigative journalist covering the Cameron R-1 School District. He publishes at Cameron School District Exposed and Breach Holder on Substack.